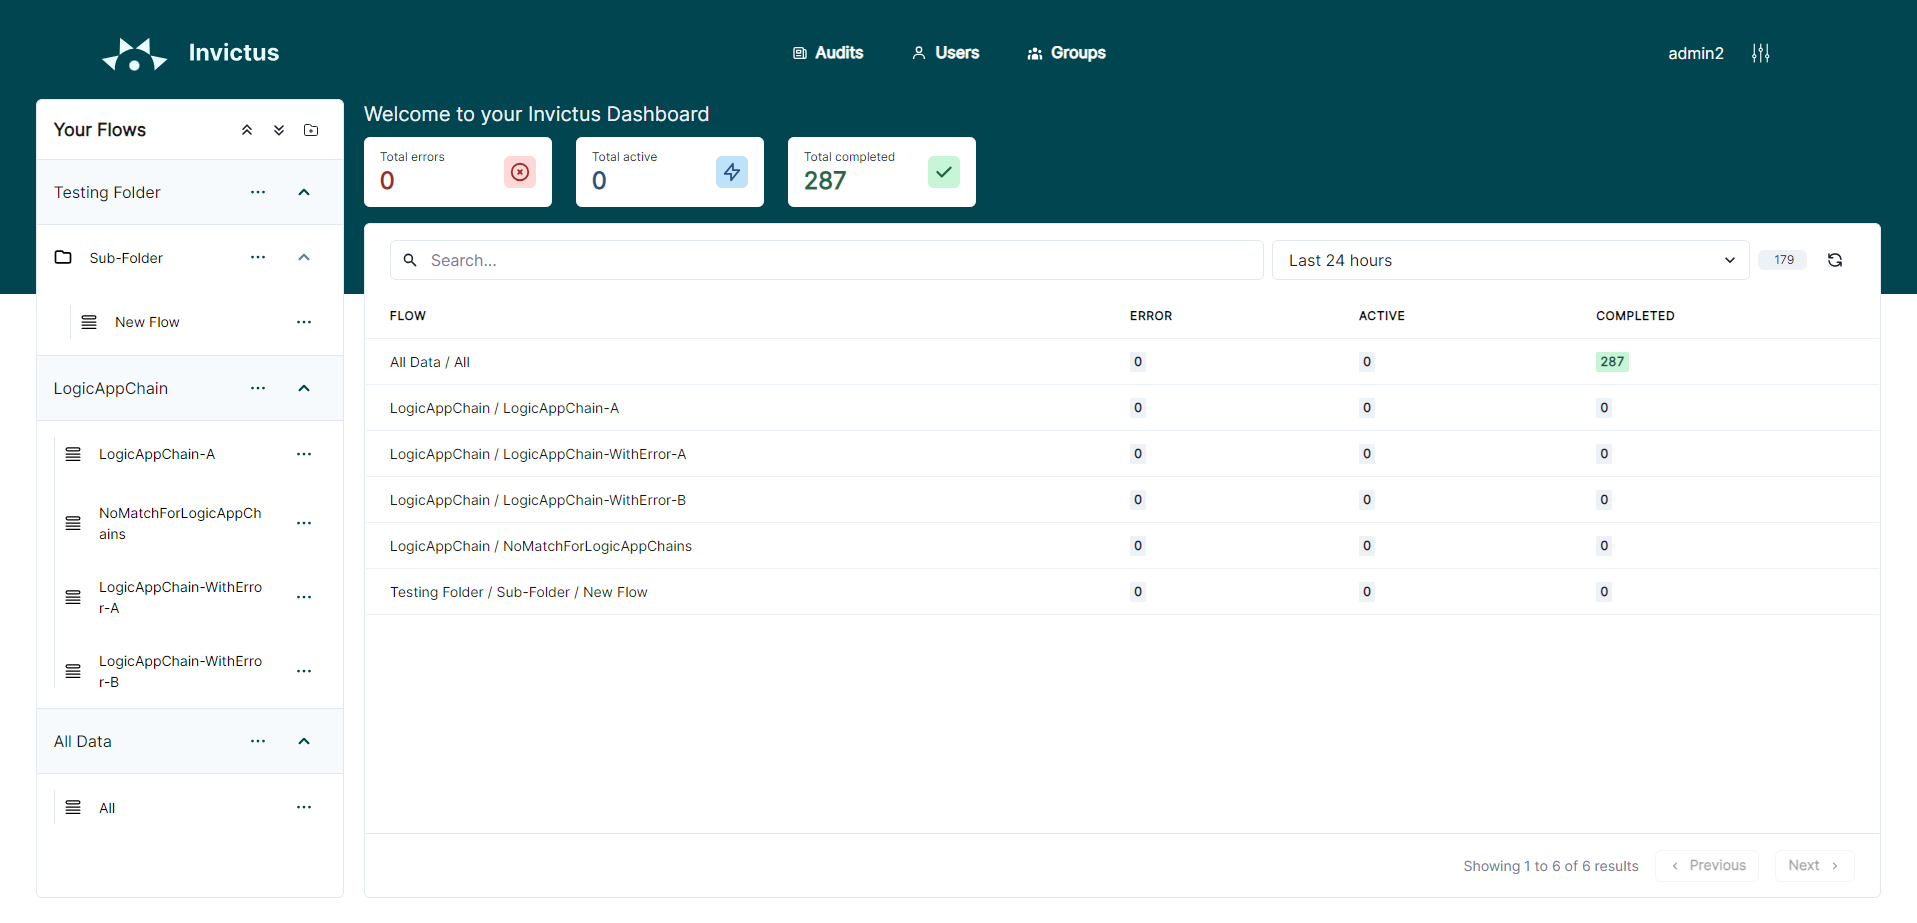
Dashboard Homepage: overview of flow statuses
The Dashboard home page shows you an overview of the current status of all your flows (= message chain). Flows are an aggregation of all diagnostic traces that can be linked to the same incoming message. Besides predefined properties, it can have optional custom properties to give context to the user.
The aggregated status of the messages received by that flow can be:
- 🔵 Active: messages currently being processed by the flow.
- 🟢 Completed: messages completed successfully by the flow.
- 🔴 Error: messages suspended, dehydrated or terminated by the flow.
👆 Clicking on the flow name will redirect you to the details of that flow.
👆 Clicking on a status will redirect you to the search page to list all flows of that status.
Organizing flows in folders
To have a clear overview of your desired flows, the Invictus Dashboard allows you to organize your flows into a folder hierarchy (with possibly one or more sub-folders). These folders are always available in the left-hand sidebar.
👇 The following example shows a root folder All Data with a sub-folder Path Test. Flows are present on the root folder (All) as well as the sub-folder (LogicAppFlow).
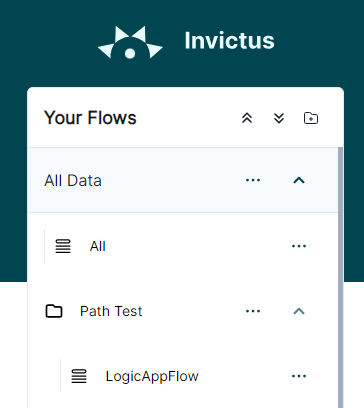
Flow detail URL's can be constructed that will redirect users to the details page of the flow, but following the breadcrumb path of the flow.
https://{your-dashboard-url}/flowpath/All Data/Path Test/LogicAppFlow
⚠️ Make sure that both the folder and the flow's name is unique horizontally so that the breadcrumb only points to a single flow.
Edit folders
👉 Home > Your Flows > ••• [Create/Edit/Delete] folder
Folders and sub-folders can be created, edited and archived, depending on the role permissions on that folder. Only a name is required and possibly a parent.